We Moved 26M Rows for $81. Fivetran Estimated It at $1.9K.

For a while, we used a simple line: why pay 5x more for Fivetran?
It was a good line. Easy to understand. Easy to remember.
Then we ran the numbers on a real high-volume Supaflow workspace and realized we were underselling it.
The difference was not 5x. It was more than 20x.
In one real Supaflow workspace, over a seven-day usage window from June 13 to June 19, 2026, we ran 453 jobs and moved 26,297,690 rows across 11,102 objects (individual tables and streams) and a broad source and destination test matrix. Supaflow used 26.98 credits to do it.
This was not a neat one-connector benchmark. The workspace had 30 source connections and 9 destination connections, including HubSpot, Salesforce, Oracle Transportation Management, PostgreSQL, SQL Server, Salesforce Marketing Cloud, SAP SuccessFactors, Google Analytics 4, Google Ads, Shopify, Stripe, SFTP file feeds, and Airtable. Those jobs loaded into Snowflake, S3 Data Lake, PostgreSQL, and SQL Server, and even pushed data back out through reverse ETL into Salesforce and Salesforce Marketing Cloud.
We also did not give the system ideal conditions. We ran the matrix concurrently to put real pressure on it: source APIs, destination writes, object-level orchestration, schema work, resets, full resyncs, and many jobs competing for runtime at once.
That is why I trust the result more. It is closer to a busy customer account than a polished demo where one fast source writes to one fast destination in isolation.
At the current Professional list price of $3 per credit, that workload is $80.95 in Supaflow usage.
Then we entered the same row count, 26,297,690, into Fivetran's 2026 Pricing Estimator as a Salesforce connection on the Standard plan for a 1-200 person company.
The estimate came back at $1,908.86 per month.
That is not 5x. It is more than 20x lower.
The benchmark
Here is the exact comparison we ran:
All Fivetran figures in this post are based on Fivetran's 2026 Pricing Estimator, using the row counts shown below as the MAR input.
| Metric | Supaflow | Fivetran estimator |
|---|---|---|
| Row volume used for comparison | 26,297,690 rows | 26,297,690 MAR |
| Jobs behind the Supaflow run | 453 jobs | N/A |
| Supaflow compute used | 12.79 compute hours | N/A |
| Supaflow credits used | 26.98 credits | N/A |
| Price shown by model | $80.95 paid credit estimate | $1,908.86 monthly list price |
| Effective price per million rows | $3.08 | $72.59 |
| Difference | $1,827.91 | |
| Multiple | 23.6x |
Supaflow's current usage page may show $0.00 for this workspace because it is on a free-tier billing state. That is the actual out-of-pocket bill for that workspace right now.
For the comparison above, we used the paid list-price equivalent: 26.98 credits x $3 per credit = $80.95. That keeps the math conservative and avoids comparing a free trial to a paid list-price estimator.
This was not one hand-picked pipeline
The row count did not come from a single neat demo pipeline.
It came from a workspace with 30 source connections, 9 destination connections, and hundreds of job runs. The job history included combinations such as:
- Salesforce to Snowflake
- Salesforce to S3 Data Lake
- Salesforce to PostgreSQL
- Salesforce to SQL Server
- PostgreSQL to S3 Data Lake
- SQL Server to S3 Data Lake
- Shopify to S3 Data Lake
- Stripe to S3 Data Lake
- SFTP CSV, JSON, JSONL, and XLSX feeds to S3 Data Lake
- Salesforce Marketing Cloud to S3 Data Lake
- SAP SuccessFactors to S3 Data Lake
- Google Analytics 4 to Snowflake
- Google Ads to Snowflake
- Airtable to PostgreSQL
This matters. Pricing comparisons are easy to distort when you test one fast connector against one easy destination.
Real data movement is messier. APIs paginate. SaaS systems throttle. Some sources return clean bulk exports. Others make you walk object by object. Some destinations accept large batches quickly. Others need more work to preserve merge semantics, schema evolution, or file layout.
Supaflow charged for the compute those jobs actually used.
Why compute pricing looks different from MAR pricing
Fivetran prices connections using Monthly Active Rows, or MAR. Fivetran describes monthly usage as the rows inserted, updated, or deleted in a month, excluding unchanged rows and initial syncs on supported connectors. You can read that definition on Fivetran's pricing page.
That model is easy to explain: active rows go up, bill goes up.
But at volume, it can hurt. A busy Salesforce org, a marketing event table, a transactional database, or a file feed that regenerates millions of rows can turn into a large MAR number even when the pipeline itself is not hard to run.
Supaflow is closer to Snowflake: pay for the compute consumed by the work.
That means two jobs with similar row counts can cost different credits. A slow API can take longer than a fast database scan. A destination write path with merge logic can take longer than an append-only file landing. A source with many small objects can spend more time on requests and metadata than a source that streams one large table.
That is the tradeoff with compute pricing. If a job took more compute, you can see it in the usage details.
This run showed it plainly. Oracle Transportation Management moved 5.6 million rows for 0.88 credits. Google Ads moved about 534,000 rows, roughly ten times less, but used 4.46 credits, the most of any source in the workspace. One is a fast bulk database extract. The other is a slow, paginated advertising API spread across dozens of small report objects. Same workspace, opposite cost profiles, and the row counts predict neither bill.
Why your savings may be higher or lower
I would not expect every team to land at exactly 23.6x. Some will save more. Some will save less. It depends on what your pipelines are actually doing.
The workspace data shows why.
For one Salesforce full resync, the source, object count, and row count were effectively the same: 13 objects and 101.2k rows. The destination changed, and the runtime changed with it:
| Job | Objects | Rows | Duration |
|---|---|---|---|
| Salesforce to PostgreSQL | 13 | 101.2k | 1m 03s |
| Salesforce to Snowflake | 13 | 101.2k | 1m 21s |
| Salesforce to SQL Server | 13 | 101.2k | 2m 08s |
| Salesforce to S3 Data Lake | 13 | 101.2k | 2m 13s |
That is not a bug in the pricing model. Loading the same data into different destinations can require different work, and compute pricing shows that instead of hiding it.
SQL Server writes can behave differently than Snowflake bulk loads. File-based lake destinations can spend time creating, staging, and organizing files. Iceberg-style table formats can add metadata and commit overhead. Append-only loads can be cheaper than merge-heavy loads. A reset or full resync can behave differently than an incremental run.
Sources vary too:
| Job | Objects | Rows | Duration |
|---|---|---|---|
| SQL Server to S3 Data Lake | 4 | 326.1k | 1m 20s |
| GA4 to Snowflake | 55 | 54k | 4m 54s |
| Google Ads to Snowflake | 42 | 29.5k | 3m 25s |
| Salesforce Marketing Cloud to S3 Data Lake | 70 | 21.7k | 11m 05s |
| PostgreSQL to S3 Data Lake | 125 | 337.4k | 10m 07s |
Rows alone do not explain those runtimes.
Some APIs throttle. Some APIs paginate aggressively. Some sources require many small requests across many objects. Some databases return large scans quickly. Others slow down because of filters, indexes, table width, or load on the source system. Some destinations are built for bulk ingest. Others prioritize transactional correctness over raw loading speed.
That is why the savings ratio moves.
Supaflow tends to look strongest when the row volume is high and the work is efficient: high-change Salesforce objects, large database extracts, generated file feeds, event tables, and other workloads where MAR grows faster than compute. The ratio can be smaller when the source is API-limited, the destination is slower, rows are very wide, merge semantics are expensive, or the workload is made of many tiny objects with fixed overhead.
The biggest exception is a low-change, high-frequency pipeline. If you run a pipeline every few minutes and almost nothing changes, MAR can be close to zero because unchanged rows do not count. Supaflow still has to wake up compute, connect to the source, check state, query or poll the system, confirm there is little or no work, and shut the run down. For no-op workloads, that fixed compute cost can matter.
So yes, there are cases where MAR pricing can look closer. If you need sub-hour freshness on a source that rarely changes, the row count may stay low. If you are moving large volumes, backfilling, refreshing files, syncing busy SaaS objects, or loading high-change databases, compute pricing is usually where the models start to separate.
For me, the important part is that the bill follows the work. If a workload runs slower, credits go up because compute time went up. If a workload runs efficiently, Supaflow does not charge more just because the row count is large.
What if only 10-20% of these rows counted toward MAR?
A fair objection to the headline number is: what if 26.3 million rows processed is not 26.3 million MAR?
That is exactly right. It will not always be.
The main benchmark uses the full row count as the Fivetran MAR input: 26,297,690 rows processed becomes 26,297,690 MAR in the estimator. That is the high-MAR case. It fits workloads where most rows are new, updated, regenerated, backfilled, or otherwise active during the month.
For high-volume database sources, the active-row percentage can be much lower. A large PostgreSQL or SQL Server source might hold years of history while only a slice of rows changes in a given month.
So we also ran two lower-MAR versions of the estimator with the same settings: Salesforce connection, Standard plan, 1-200 person company.
| Scenario | Fivetran MAR input | Fivetran estimate | Supaflow list-price usage | Difference |
|---|---|---|---|---|
| Full row-count input | 26,297,690 MAR | $1,908.86/month | $80.95 | 23.6x lower |
| About 20% MAR input | 5,230,000 MAR | $1,081.33/month | $80.95 | 13.4x lower |
| About 10% MAR input | 2,600,000 MAR | $772.00/month | $80.95 | 9.5x lower |
Even when the MAR input drops to about 10% of the rows Supaflow processed, Fivetran's estimator still returns $772.00/month. Supaflow processed the full 26.3 million rows for $80.95 at paid list price. That is still $691.05 lower, or 89.5% less.
At about 20% MAR, the gap is wider: $1,081.33/month in the estimator versus $80.95 in Supaflow usage. That is $1,000.38 lower, or 92.5% less.
That is why I do not think the comparison depends on every processed row becoming MAR. The savings ratio changes as the active-row percentage changes. But in this run, even after cutting the Fivetran MAR input to a small fraction of Supaflow's processed rows, the estimator was still far above the actual compute usage.
The daily usage tells the story
The seven-day Supaflow usage window looked like this:
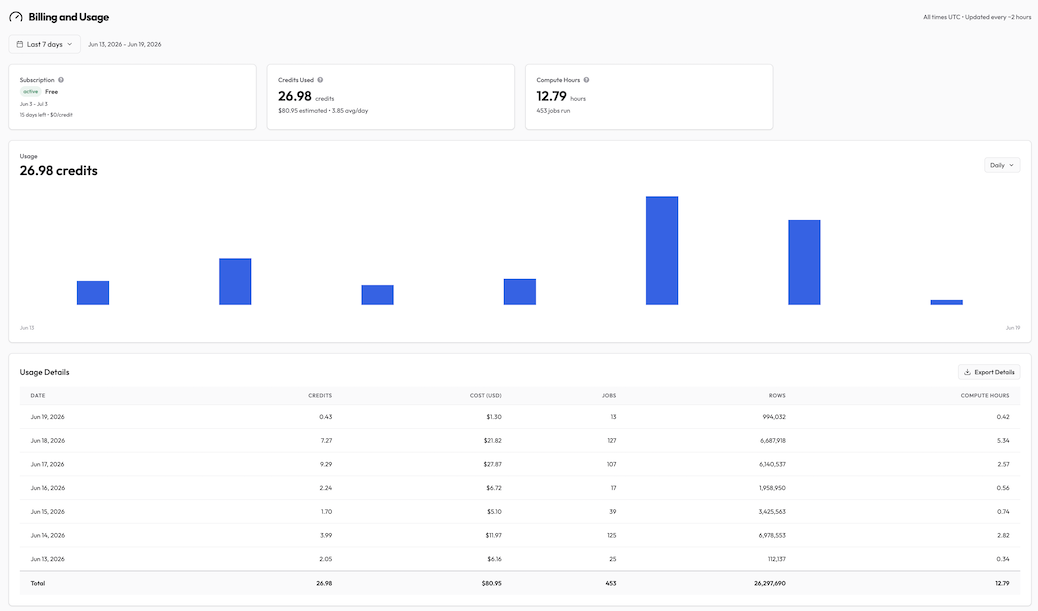
| Date | Credits | Jobs | Rows | Compute hours |
|---|---|---|---|---|
| Jun 13, 2026 | 2.05 | 25 | 112,137 | 0.34 |
| Jun 14, 2026 | 3.99 | 125 | 6,978,553 | 2.82 |
| Jun 15, 2026 | 1.70 | 39 | 3,425,563 | 0.74 |
| Jun 16, 2026 | 2.24 | 17 | 1,958,950 | 0.56 |
| Jun 17, 2026 | 9.29 | 107 | 6,140,537 | 2.57 |
| Jun 18, 2026 | 7.27 | 127 | 6,687,918 | 5.34 |
| Jun 19, 2026 | 0.43 | 13 | 994,032 | 0.42 |
| Total | 26.98 | 453 | 26,297,690 | 12.79 |
The pattern is clear: row count and credits move together, but not perfectly.
June 14 moved the most rows of any day, nearly 7 million, for 3.99 credits. June 17 moved fewer rows, about 6.1 million, but cost 9.29 credits, more than double. Same workspace, same week, less data on the more expensive day.
June 17 was the most expensive day of the run, partly due to slower Iceberg-style writes on the lake destination that add metadata and commit overhead on top of the row movement. Even then, that day's Supaflow usage was 9.29 credits, or $27.87 at the $3 list price, to process 6,140,537 rows. We then used that same row count as the MAR input in the Fivetran estimator, as a Salesforce connection on the Standard plan: it came back at $1,134.15 per month. For that isolated 6.1 million-row workload, Supaflow's list-price compute cost was still more than 40x lower.
That is the point. Rows are not equal work, and compute pricing does not pretend they are.
If a source is slower, if a destination needs more work, or if a job has more orchestration overhead, the compute number reflects that. If the job is efficient, the price stays low even when the row count is high.
Across this run, Supaflow processed about 974,711 rows per credit and about 2.1 million rows per compute hour.
The practical takeaway
The question I care about is not "can we make one benchmark look cheap?"
The comparison I care about is this:
- Fivetran's 2026 Pricing Estimator returned $1,908.86/month for 26,297,690 MAR.
- Supaflow's paid list-price equivalent for processing 26,297,690 rows was $80.95.
- That is $1,827.91 lower on the same row-count input.
- That is 95.8% less.
- That is more than 20x lower: 23.6x on this run.
For high-volume workloads, even "5x cheaper" can undersell the difference. The real lesson is that per-row and MAR pricing can drift away from the actual cost of doing the work.
If your pipeline spends ten minutes moving millions of rows, why should the bill behave like every row was equally expensive to process?
How to read this comparison fairly
This is an estimator exercise, not a claim about every possible Fivetran invoice.
Supaflow's usage page reports rows processed by jobs. Fivetran's estimator asks for MAR, and Fivetran's MAR rules can exclude initial syncs and unchanged rows. Your exact number will depend on your sources, your change rate, your sync cadence, and your contract.
But the pricing pattern is still clear.
When the unit is active rows, high-change systems create high bills.
When the unit is compute, the bill follows the actual work required to move the data.
For teams moving large volumes through Salesforce, Salesforce Marketing Cloud, PostgreSQL, SQL Server, SFTP feeds, marketing APIs, and other high-row-count sources, this is where Supaflow can be much cheaper.
Try the same test with your own data
If you are evaluating Supaflow against Fivetran, do not stop at a theoretical calculator.
Run your real pipelines.
Look at your Supaflow usage page:
- total rows
- total jobs
- compute hours
- credits used
Then put your comparable row volume into Fivetran's 2026 Pricing Estimator and compare it to Supaflow's credit usage.
If your workload is small, the difference may be modest.
If your workload looks like the one above, the difference is not a rounding error. It is the budget.
See the pricing plans, then start Supaflow free or book a demo and bring your current MAR, invoice, or row counts. We will help you run the math on your real workload.