How Much Does a Data Pipeline Cost? 6 Models Compared

How much does a data pipeline cost?
The honest answer is not a universal monthly range. It depends on what the vendor meters. The same pipeline can look inexpensive under one pricing model and become the largest line item in your data stack under another.
A tool may charge for distinct rows that changed, every event loaded, gigabytes moved, reserved capacity, or the compute time required to finish the work. Before comparing prices, you have to translate each quote into the same workload.
Here is one real example. A Supaflow workspace moved 26.3 million rows across 453 jobs using 26.98 credits. At the current Professional list price of $3 per credit, that was $80.95. Fivetran's 2026 Pricing Estimator returned $1,908.86 per month when we entered the same row count as Monthly Active Rows (MAR).
The usage screen rounds the credit total and cost independently. It displays 26.98 credits to two decimal places, while the $80.95 estimate is calculated from the underlying unrounded daily credit values. Multiplying only the displayed credit total would produce $80.94 because that calculation starts from an already rounded number.
That does not mean every 26-million-row pipeline will have the same result. It shows why the billing unit matters more than the headline price.
Data Pipeline Pricing Models at a Glance
Most managed data pipeline tools use one or more of these pricing models:
| Pricing model | What is metered | Cost tends to rise when | Common surprise |
|---|---|---|---|
| Monthly Active Rows (MAR) | Distinct rows inserted, updated, or deleted during the month | Many unique records change | The same source is synced through multiple connections or into multiple destinations |
| Rows or events | Records or events processed | Event volume, backfills, or regenerated files grow | A routine full refresh consumes the monthly quota |
| Data volume | Rows, gigabytes, or another measure of data moved | Records get wider or bulk volume grows | Compression and source type can change how usage is measured |
| Capacity | Reserved workers or processing capacity | You need more throughput or concurrency | You pay for headroom even when it is idle |
| Compute or task time | Runtime multiplied by a node or credit rate | Jobs run longer or use larger nodes | Slow APIs and frequent no-op runs still consume time |
| Flat subscription | A plan, connector package, or annual commitment | You need higher tiers, more connectors, or governance features | Overage and usage charges may sit on top of the base price |
The categories are not mutually exclusive. A contract can include an annual commitment, a per-connection minimum, and usage charges at the same time. Compare the full billing formula, not just the unit shown most prominently on the pricing page.
Vendor pricing changes frequently. The model descriptions and linked pricing pages in this guide were checked on August 9, 2026.
1. Monthly Active Rows (MAR)
MAR pricing counts distinct rows that become active during a calendar month. Fivetran defines MAR using distinct primary keys tracked separately by account, destination, connection, table, activation, and activation sync.
If one customer row changes ten times in the same month, it generally counts as one MAR rather than ten. That makes MAR attractive for pipelines that repeatedly update a relatively small set of records.
The economics change when a large share of the source becomes active:
- A high-volume event table creates new primary keys continuously.
- A busy CRM may update millions of different contacts, activities, or opportunities.
- Two connections that replicate the same source into separate destinations can be counted separately.
- History-mode workloads can create additional active rows as values change.
Initial syncs and qualifying re-syncs are free under Fivetran's current pricing rules, so do not model every row ever stored as paid MAR. Estimate the distinct rows that will actually become active each month, by connection.
2. Per-Row or Event Pricing
Row and event models meter the records processed by the pipeline. Hevo's published pipeline plans, for example, include a monthly Events quota, with additional usage handled as on-demand Events.
This model is easy to understand when every source sends clean incremental changes. It becomes harder to forecast when a connector must refresh data in bulk, replay history, or ingest regenerated files.
Ask what the vendor calls an event:
- Is an inserted, updated, and deleted row one event each?
- Does a retry count again?
- Does a full refresh count every returned row?
- Are transformations and reverse ETL measured separately?
- What happens when the monthly event quota is exhausted?
A price per million events is only useful after those rules are clear.
3. Data-Volume Pricing
Volume pricing charges for the amount of data moved, often in rows for API sources and gigabytes for databases or files. Airbyte's current cloud pricing uses volume-based pricing for its Standard and Plus plans while offering capacity-based pricing on Pro.
Volume pricing can work well when data sizes are stable and easy to measure. It can surprise teams when a narrow operational table becomes a wide semi-structured payload or when historical backfills are included in billable volume.
Confirm whether the vendor measures:
- source bytes or destination bytes
- compressed or uncompressed data
- rows read or rows written
- only changed data or the entire extract
- failed and retried transfers
Ten million narrow ID-and-timestamp rows are not the same amount of work or data as ten million wide JSON records.
4. Capacity Pricing
Capacity pricing reserves a fixed amount of processing power. Instead of paying more whenever volume spikes, you add workers or capacity when the current allocation cannot meet your throughput target.
The advantage is budget predictability. The tradeoff is utilization: unused capacity still has a cost, while insufficient capacity can create a growing backlog.
Capacity pricing usually fits teams with consistent workloads, known service-level targets, and enough pipelines to keep the reserved workers busy. It is less natural for a small number of highly seasonal pipelines unless the plan makes it easy to scale capacity down.
5. Compute or Task-Time Pricing
Compute pricing follows how long the work runs and how large the worker is. Matillion describes task-hour credit consumption for pipeline execution. Snowflake similarly bills virtual warehouses according to size, cluster count, and runtime, with per-second billing after a 60-second minimum.
Supaflow uses the same broad idea. An S (Small) Agent uses one Supaflow credit per billable hour. Larger nodes have published credit rates, and usage is measured per second after a 60-second minimum per job. On the Professional plan, one credit currently costs $3.
Compute pricing rewards efficient bulk movement. A job that moves millions of rows quickly does not become expensive just because the row count is large.
But compute is not automatically cheaper for every workload. A pipeline that wakes up every five minutes, spends time authenticating and checking for changes, then finds nothing still used compute. A slow, heavily paginated API can also cost more time than a fast database extract with many more rows.
How the Same Workload Behaves Under Each Model
Before choosing a model, look at how your source actually changes:
| Workload pattern | MAR | Rows/events | Volume | Capacity | Compute |
|---|---|---|---|---|---|
| Large initial backfill | Often free under current Fivetran rules | Potentially high | High | Uses available capacity | Depends on runtime |
| Millions of new unique events | High | High | Depends on record width | Stable until capacity is exceeded | Low if the extract is fast |
| Same rows updated repeatedly | Counts each distinct row once per month | May count every update | Grows with every transfer | Stable until capacity is exceeded | Grows with runtime |
| Frequent run with no changes | Near zero | Near zero | Near zero | Uses reserved capacity | Pays the per-run compute minimum |
| Slow API with few rows | Low | Low | Low | Occupies capacity longer | Can be relatively expensive |
| Fast bulk database extract | High if many rows are active | High | High | Efficient when capacity is available | Can be relatively inexpensive |
This is why vendor calculators can disagree by an order of magnitude without either calculator being mathematically wrong. They are pricing different things.
The Costs That Do Not Appear in the Headline Price
The ingestion bill is only one part of the data pipeline cost. A useful estimate includes:
Destination compute
Loading, merging, clustering, and transforming data can consume Snowflake, Redshift, Databricks, or BigQuery resources. A low ingestion price can still produce an expensive destination workload if every sync rewrites large tables.
Network and staging
Cross-region or cross-cloud movement can create egress charges. Some pipelines also require object storage for staging, file retention, or replay.
Transformations and orchestration
Check whether dbt runs, scheduled models, reverse ETL, workflow steps, and task execution use the same allowance as ingestion or have separate meters.
Development and maintenance
Open-source software can remove a license fee without removing the work. Include engineering time for deployment, upgrades, connector breakage, schema changes, alerting, and incident response.
Support and governance
SSO, role-based access control, audit logs, private networking, longer log retention, and support SLAs often require a higher plan even when the pipeline volume is small.
A 10-Minute Data Pipeline Cost Worksheet
Use one row per source-to-destination connection. Do not combine all company data into one monthly total; several pricing models meter each connection separately.
| Input | What to collect |
|---|---|
| Source and destination | The exact connection pair, including separate development and production destinations |
| Total source rows | Current table sizes and expected historical backfill |
| Monthly active rows | Distinct primary keys inserted, updated, or deleted each month |
| Monthly processed rows or events | Include append-only events, re-imported files, and recurring full refreshes |
| Monthly data volume | Expected rows and GB transferred after normal source-side filtering |
| Sync frequency | Runs per day or month, including no-op runs |
| Runtime | Median and slow-run duration on the intended node size |
| Destination work | Append, merge, deduplication, transformation, and clustering requirements |
| Fixed charges | Plan fees, connector minimums, annual commitments, users, and support |
Then calculate each quote using its real billing unit:
MAR cost      = distinct active rows per connection x the vendor's MAR curve
Event cost    = billable events x event rate + plan or overage charges
Volume cost   = billable rows or GB x the applicable rate
Capacity cost = reserved workers or capacity for the billing period
Compute cost  = sum of runtime x node credit rate x price per credit
Finally, add destination compute, storage, network, and the engineering time required to operate the pipeline.
A Real Cost Example: 26.3 Million Rows
We measured a seven-day Supaflow workspace that included 30 source connections, nine destination connections, and a mix of databases, SaaS APIs, file feeds, warehouses, and reverse ETL workloads.
| Metric | Measured result |
|---|---|
| Jobs | 453 |
| Objects processed | 11,102 |
| Rows processed | 26,297,690 |
| Compute hours | 12.79 |
| Supaflow credits | 26.98 |
| Supaflow Professional list-price equivalent | $80.95 |
| Fivetran estimator using 26,297,690 MAR | $1,908.86/month |
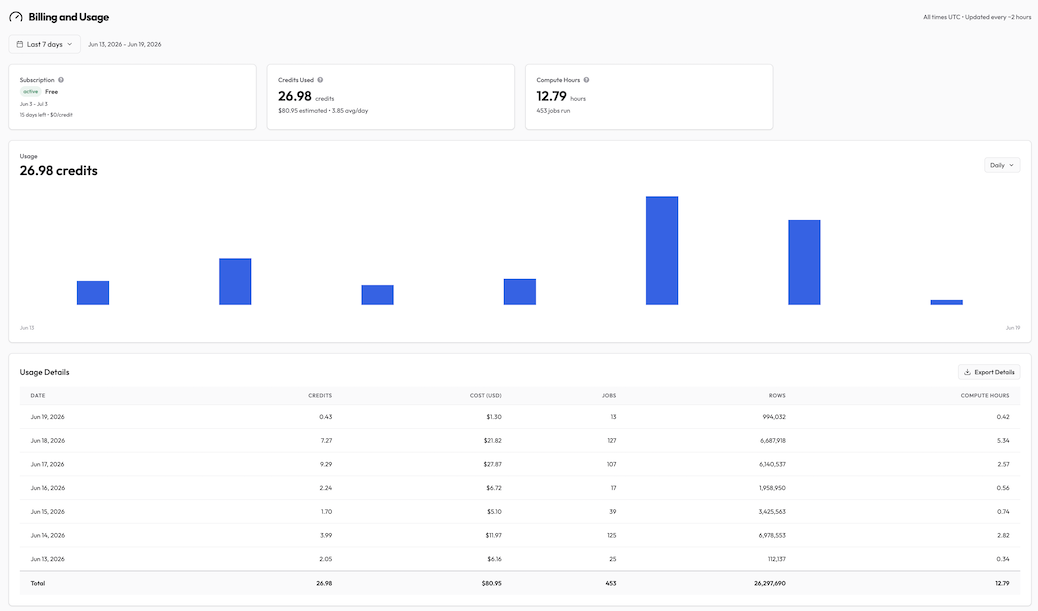
The comparison needs one important qualification: Supaflow reports processed rows, while Fivetran charges for MAR. Processed rows and MAR are not always equal.
That is why we also tested lower MAR assumptions. Using approximately 20% of the processed rows as MAR returned a Fivetran estimate of $1,081.33 per month. At approximately 10%, the estimate was $772 per month. Supaflow's measured paid list-price equivalent remained $80.95 for the full workload.
Read the complete 26-million-row cost benchmark for the daily usage, estimator inputs, lower-MAR scenarios, and methodology.
Which Pricing Model Is Cheapest?
There is no model that wins every workload.
MAR can be attractive when a large database changes slowly or the same small set of rows updates many times during the month.
Row or event pricing can be predictable when the source emits clean incremental records and you know the event volume. It becomes harder to control around backfills and full-refresh sources.
Volume pricing can fit bulk transfers when monthly GB is stable. Watch record width, history, and the vendor's definition of billable volume.
Capacity pricing can produce a stable budget when you have enough consistent work to use the reserved workers.
Compute pricing is often strongest for high-volume, efficient pipelines because the bill follows runtime instead of row count. Watch slow APIs and high-frequency jobs that frequently find no changes.
The safest choice is the model you can test against a real billing period. Estimates are useful for building a shortlist; an instrumented trial shows what the workload actually consumes.
Questions to Ask Before You Sign
- What exactly is the billable unit?
- Are initial syncs, re-syncs, retries, and historical backfills charged?
- Is usage counted separately by connection, destination, environment, or table?
- Are there per-connection minimums or an annual commitment?
- What happens when the included quota is exhausted?
- Are transformations, orchestration, and reverse ETL billed separately?
- Which security, governance, and support features require a higher plan?
- Can you export usage details by pipeline, day, and billing unit?
- Can you run a real workload before committing to an annual contract?
If the vendor cannot show how a job becomes an invoice line, the price is not transparent yet.
Frequently Asked Questions
How much does ETL cost per month?
There is no reliable universal average because ETL platforms meter different units. A small workload may fit within a free tier, while a high-change production workload can reach a large annual commitment under row-based pricing. Estimate active rows, processed rows or events, data volume, sync frequency, and runtime before comparing quotes.
What is MAR in data pipeline pricing?
Monthly Active Rows are distinct rows inserted, updated, or deleted during a calendar month. Under Fivetran's current rules, a row updated several times in one month generally counts once for that connection, while the same source replicated through multiple connections can contribute MAR separately.
Is compute pricing better than per-row pricing?
Compute pricing is often better for fast, high-volume pipelines because millions of efficiently moved rows do not automatically create millions of billable units. Per-row or MAR pricing can be better for low-change workloads that run frequently but process very little data. Test both models with your actual change pattern.
How can I reduce data pipeline costs?
Remove unused tables, avoid unnecessary full refreshes, reduce no-op run frequency, use incremental sync where it is reliable, right-size workers, and monitor the destination work created by each load. The biggest savings often come from changing the billing model rather than tuning a few queries.
Estimate Your Cost with Your Own Workload
Use the Supaflow pricing calculator to select a source, destination, sync frequency, and monthly row count. It returns a directional estimate for an S (Small) Agent; actual usage depends on source speed, destination write path, retries, backfills, and runtime.
Then run the pipeline during the 31-day free trial and compare the estimate with the Usage page. Supaflow shows jobs, rows, compute hours, and credits so you can see how the workload becomes the bill.
Review the current Supaflow pricing plans, or book a demo and bring your MAR estimate, current invoice, or pipeline runtime. We will help you compare the models using your real data.
 Ask Claude